A Gantt chart is a tool used to plan, schedule, and track projects. It is a type of bar chart that displays the start and end dates of each task in a project, as well as the dependencies between tasks. Gantt charts are commonly used in project management to visualize the progress of a project and identify potential issues or bottlenecks.
What is a Gantt chart used for?
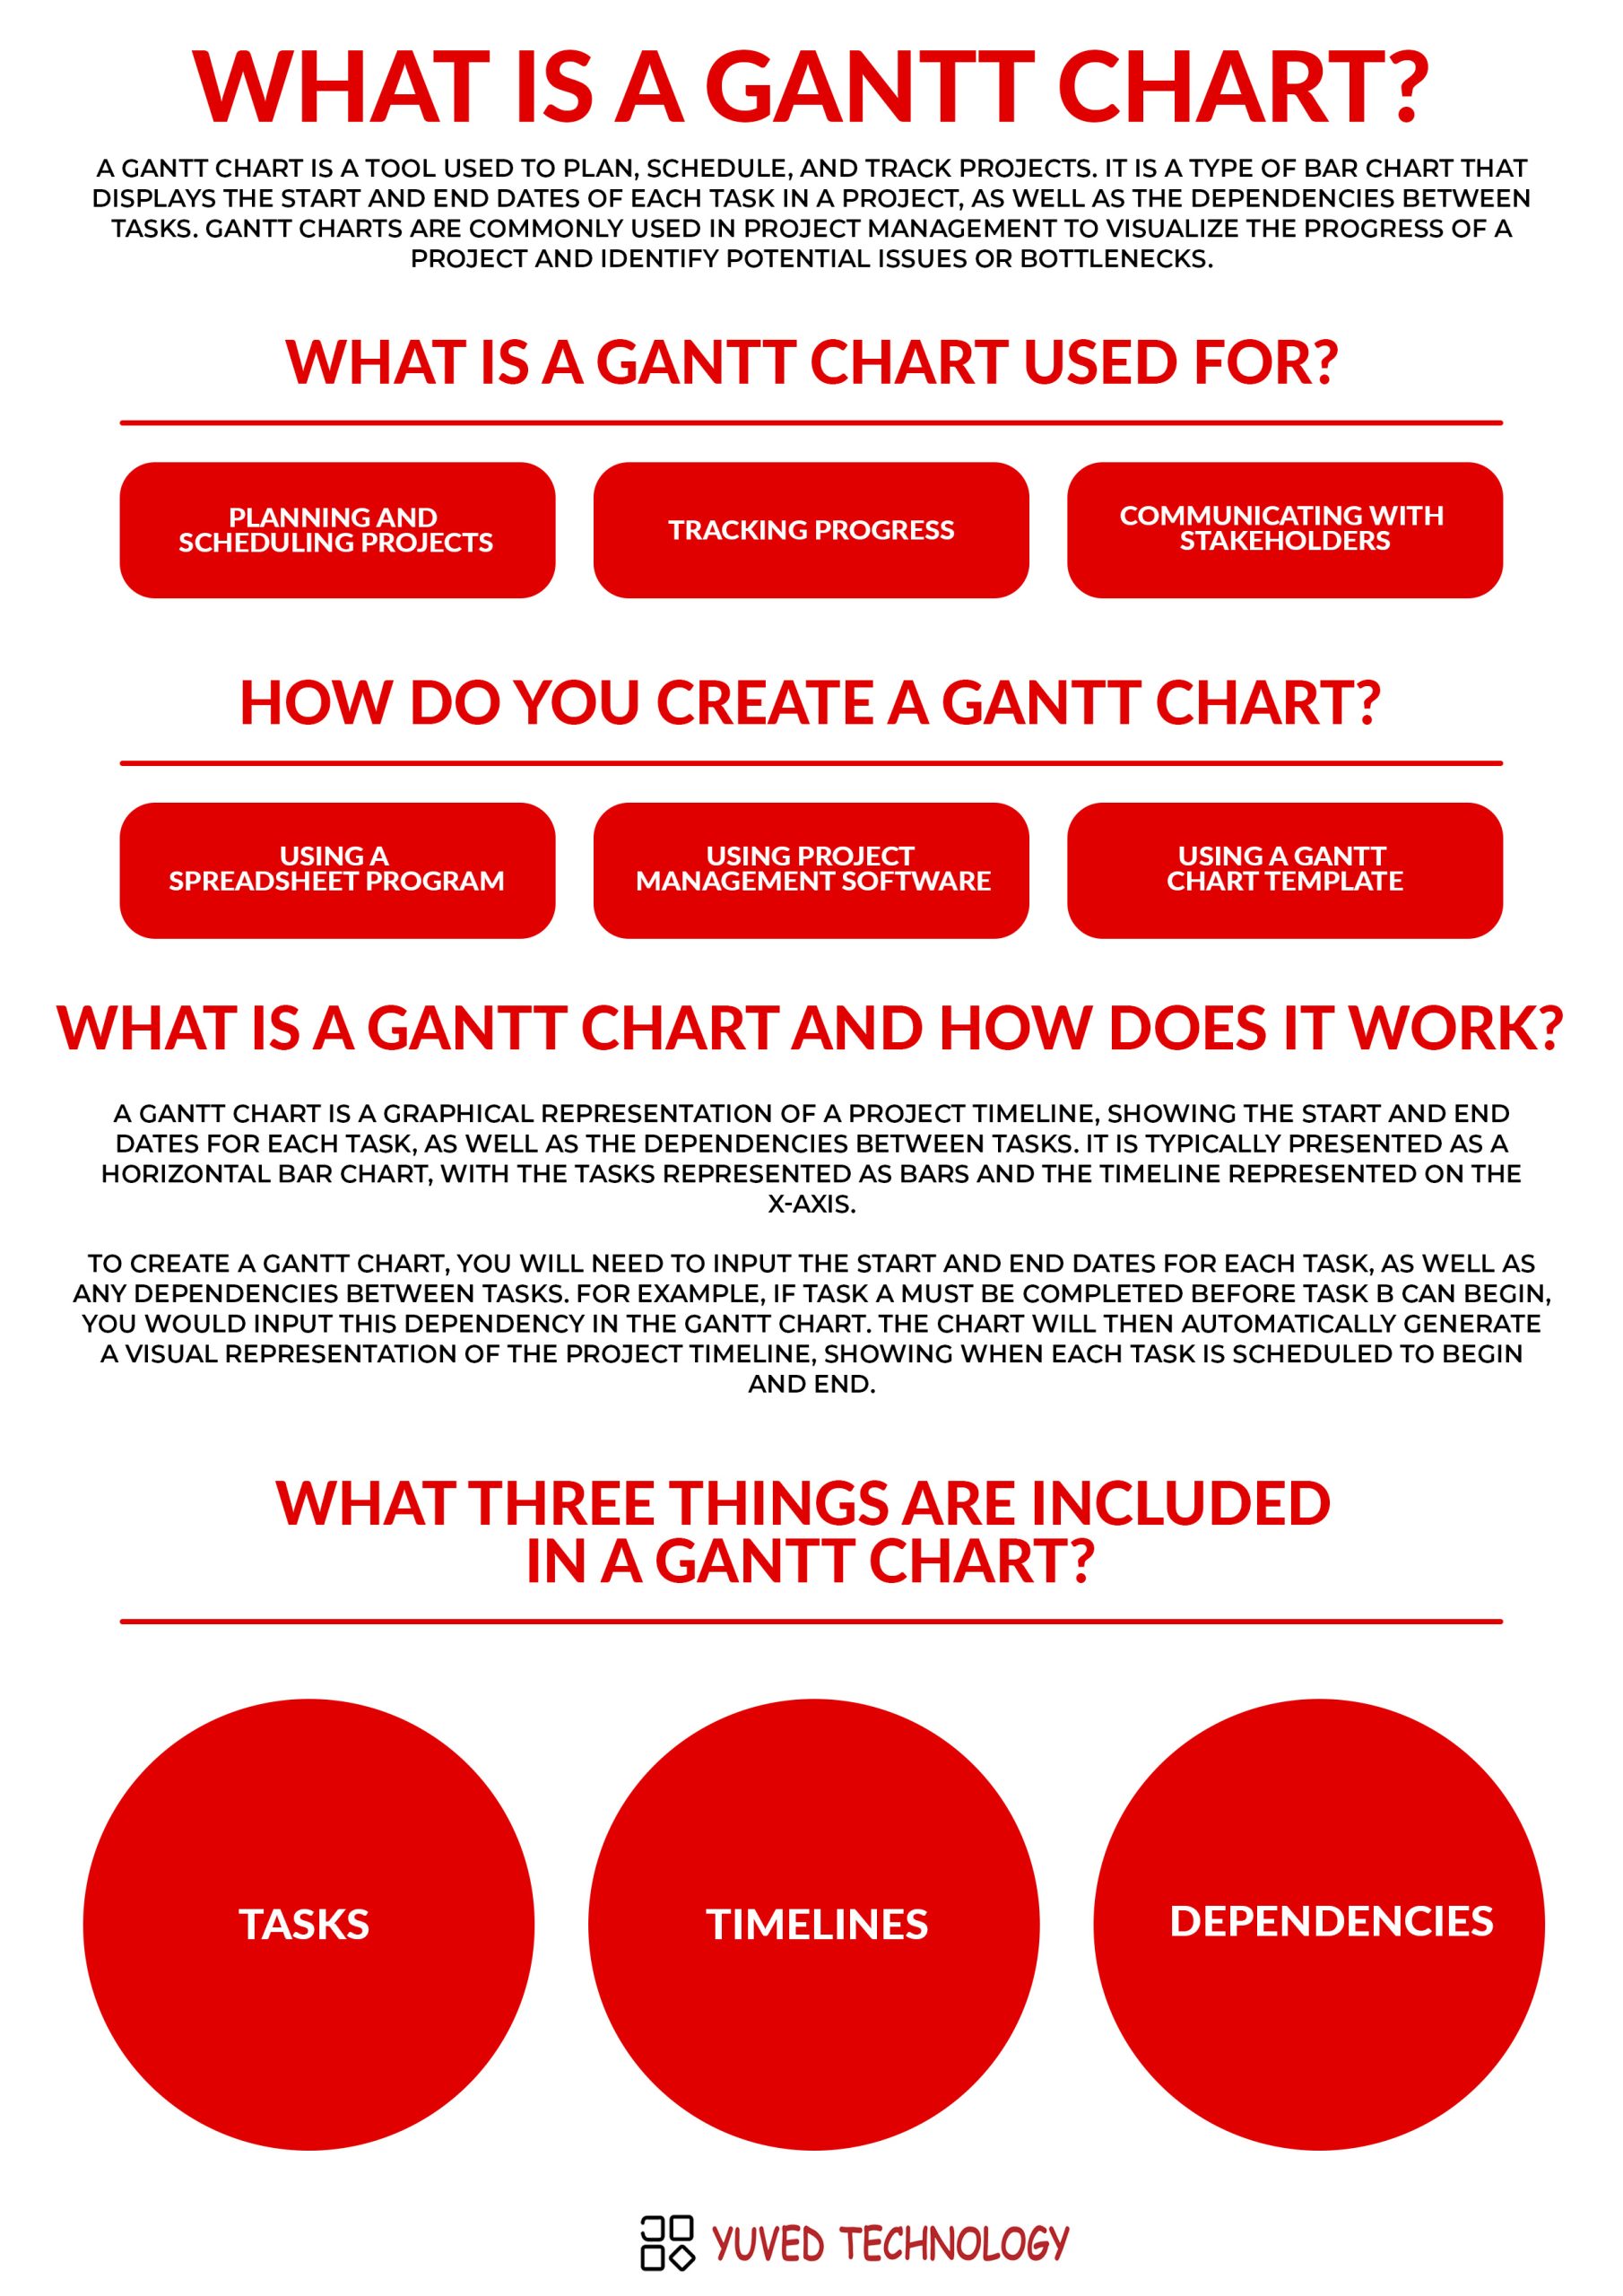
Gantt charts are used for a variety of purposes in project management, including:
- Planning and scheduling projects: Gantt charts can help project managers plan and schedule tasks, resources, and budgets for a project. They provide a clear visual representation of the project timeline, making it easy to identify potential conflicts or dependencies between tasks.
- Tracking progress: Gantt charts can be used to track the progress of a project, as well as identify any delays or issues that may arise. This can help project managers identify potential problems and take corrective action to get the project back on track.
- Communicating with stakeholders: Gantt charts can be used to communicate project plans and progress to stakeholders, such as clients or team members. They provide a clear visual representation of the project timeline, making it easy for stakeholders to understand the status of the project and any potential risks or issues.
How do you create a Gantt chart?
There are several ways to create a Gantt chart, including:
- Using a spreadsheet program: Many spreadsheet programs, such as Microsoft Excel or Google Sheets, have built-in functions for creating Gantt charts. Simply input the start and end dates for each task, as well as any dependencies, and the chart will be automatically generated.
- Using project management software: Many project management software programs, such as Asana or Trello, have built-in Gantt chart features. Simply input the tasks and dates for your project and the software will generate a Gantt chart for you.
- Using a Gantt chart template: There are many free Gantt chart templates available online that you can use to create a chart for your project. Simply input the tasks and dates into the template and the chart will be generated for you.
What is a Gantt Chart and how does it work?
A Gantt chart is a graphical representation of a project timeline, showing the start and end dates for each task, as well as the dependencies between tasks. It is typically presented as a horizontal bar chart, with the tasks represented as bars and the timeline represented on the x-axis.
To create a Gantt chart, you will need to input the start and end dates for each task, as well as any dependencies between tasks. For example, if Task A must be completed before Task B can begin, you would input this dependency in the Gantt chart. The chart will then automatically generate a visual representation of the project timeline, showing when each task is scheduled to begin and end.
What three things are included in a Gantt Chart?
A Gantt chart typically includes the following elements:
- Tasks: Each task in the project is represented as a horizontal bar on the chart. The length of the bar represents the duration of the task, and the position of the bar on the x-axis represents the start and end dates for the task.
- Timelines: The x-axis of the chart represents the timeline for the project, with the start and end dates for the project clearly marked.
- Dependencies: Any dependencies between tasks are shown on the chart as a line connecting the two tasks. This helps project managers visualize the order in which tasks must be completed and identify any potential conflicts or issues.
In conclusion, a Gantt chart is a useful tool for planning, scheduling, and tracking projects. It provides a clear visual representation of the project timeline and helps project managers identify potential issues or bottlenecks. By including tasks, timelines, and dependencies in a Gantt chart, project managers can more effectively plan and execute projects, leading to better results and increased efficiency. There are many different ways to create a Gantt chart, including using spreadsheet programs, project management software, or templates, making it a versatile tool for project management.